Power Dash
A home energy dashboard. It combines the retailer's smart-meter data with live readings from the solar inverter and smart plugs, so I can see what the house uses, what it generates and where the money goes.
What it does
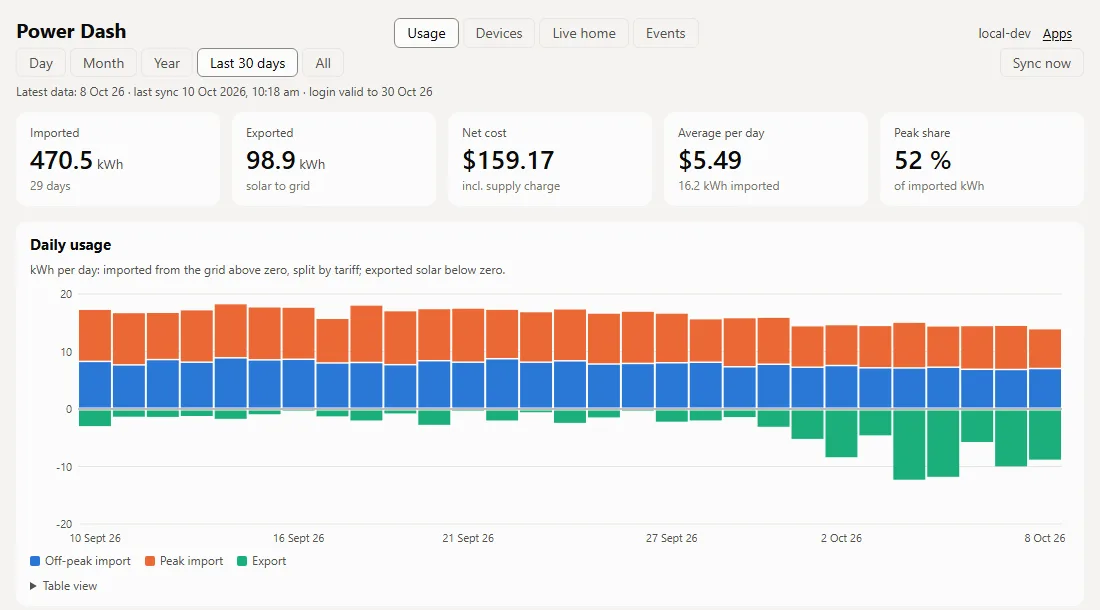
- Usage: hourly and daily smart-meter data from the electricity retailer, paged by day, month or year or shown as a rolling 30 days or all time. Imports are split by tariff (peak and off-peak), exports are shown below zero, cost includes the daily supply charge, and an hour-of-day heat map shows when the grid is used.
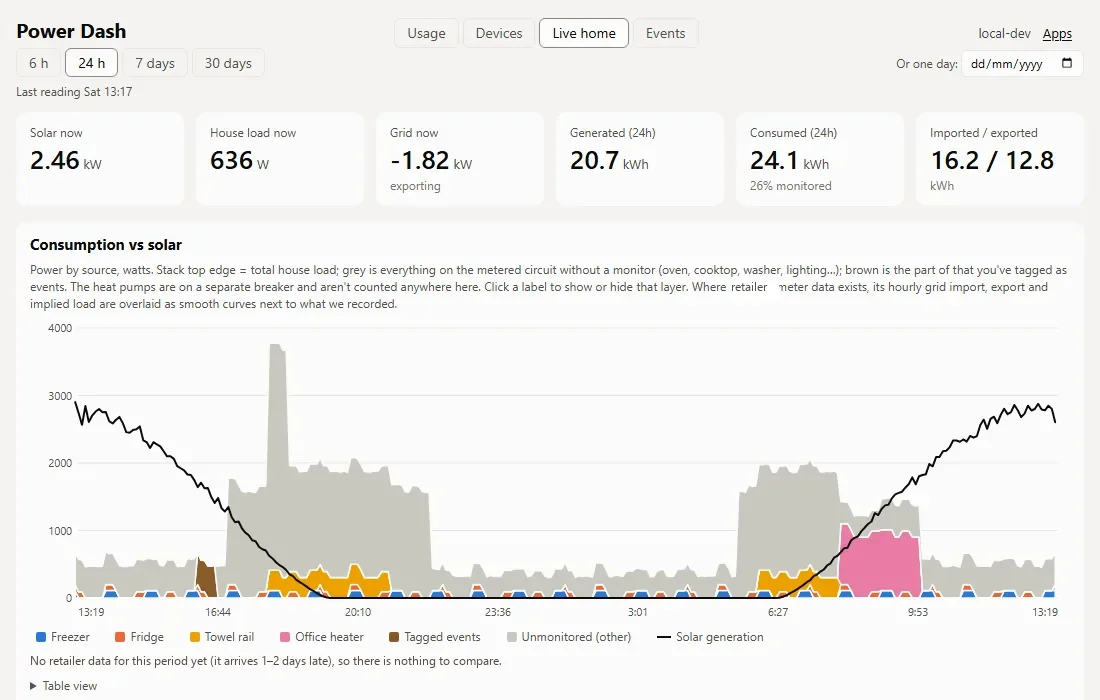
- Live home: solar generation, house load and grid import or export from the inverter, with a stacked chart that splits the load by smart plug and shows the rest as unmonitored. Ranges run from six hours to 30 days, or any single day.
- Devices: latest watts and 24-hour energy per smart plug, temperature and humidity sensors, inverter and poller health, the washing machine's current cycle and recent runs, and, if enabled, a robot vacuum card.
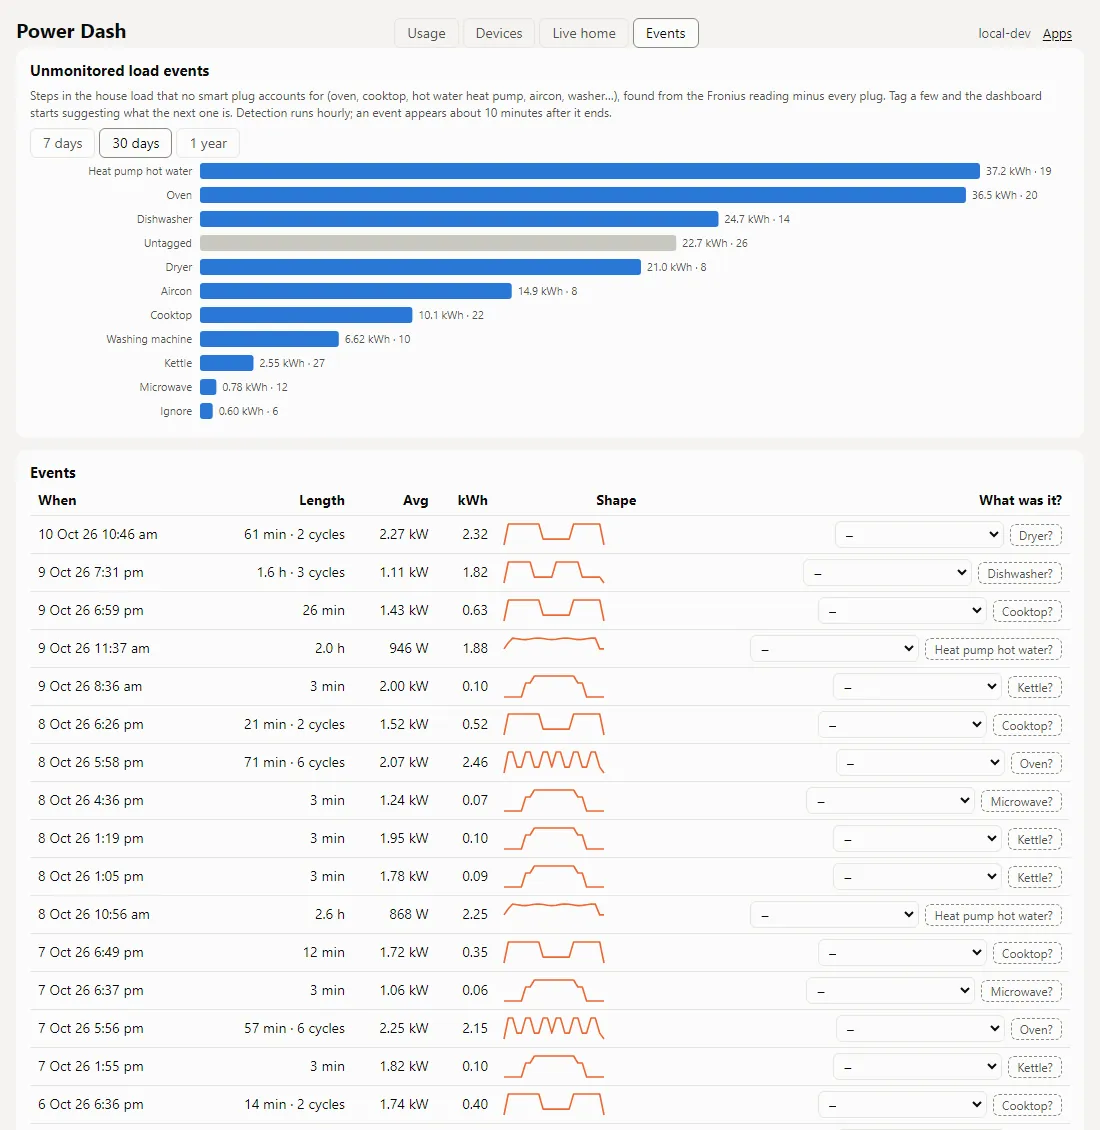
- Events: finds sustained steps in the load that no plug accounts for (an oven, a cooktop, the hot water heat pump) and lists them with a small trace. Each can be tagged by hand, and once a few are tagged the page suggests a tag for the rest, based on power, length, cycling and time of day. Runs that overlap a washing machine cycle are labelled automatically, and kilowatt-hours are totalled by tag.
- Where meter data exists for a period, it is overlaid on what was recorded locally so the two can be reconciled. The meter data arrives one to two days late.
Under the hood
- A Cloudflare Worker with static assets and a D1 database, with each part switched on or off by a feature list. Three crons: a sync of the meter data every six hours, a washing-machine poll every five minutes and an hourly rollup.
- The meter sync uses the retailer's customer web login, which rotates its session cookie on every refresh. The Worker saves the new cookie before doing anything else, and re-fetches the last few days each time because recent data gets revised.
- A Python poller on an old Raspberry Pi reads the inverter and the smart plugs every 15 seconds and posts batches to the Worker with a bearer token. It uses only the standard library plus a small pure-Python client for the plugs' encrypted local protocol.
- The Pi has no battery-backed clock, so samples taken before the network time arrives are stamped from a monotonic clock and corrected afterwards. Samples are buffered in memory for about eight hours if the Worker is unreachable.
- Raw 15-second rows serve the short ranges. An hourly job folds them into 5-minute rows that the longer ranges read, which keeps D1 reads low.
- Event detection works on the house load minus every monitored plug, as a one-minute series against a rolling low-percentile baseline. A reading only counts when every plug that normally reports did, so a plug dropping off Wi-Fi never looks like an appliance switching on.
- The charts are hand-written SVG with no charting library or framework. Parsing, series, event and washer logic are pure functions covered by Node's test runner.
A personal tool for one household, behind a login. Screenshots use invented data generated for the purpose.