NaviDrone
A personal Android Auto dashboard and trip logger for a 2008 Subaru Outback. It reads the car through a Bluetooth ELM327 adapter, draws a speedo, fuel figures and an offline map on the car's screen, records every drive, and uploads the trips to a small Cloudflare dashboard that also keeps fuel and service history.
What it does
- Logs trips automatically. A foreground service connects to the adapter, waits for the engine, then records speed, RPM, airflow, throttle, load, temperatures, fuel trims, battery voltage, fuel level and GPS a few times a second. A trip ends about 20 seconds after the engine stops.
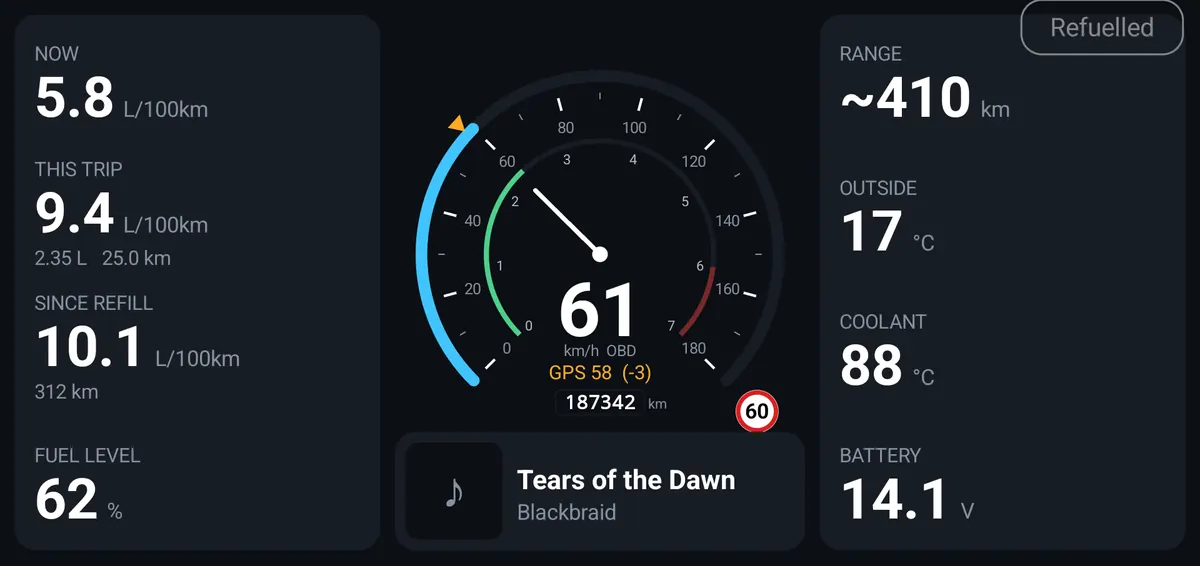
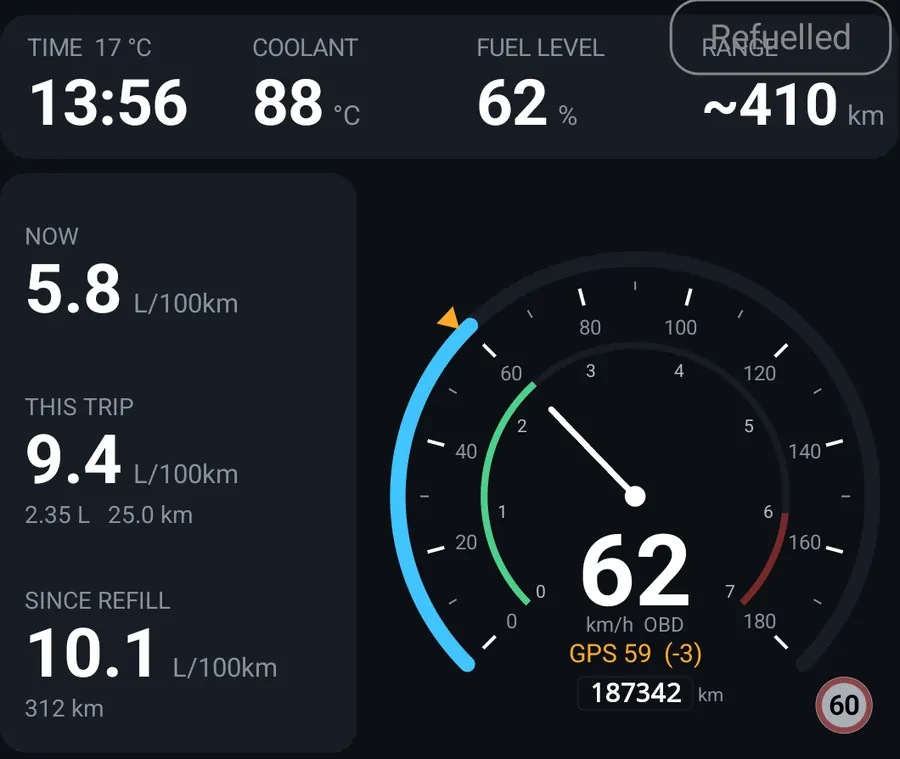
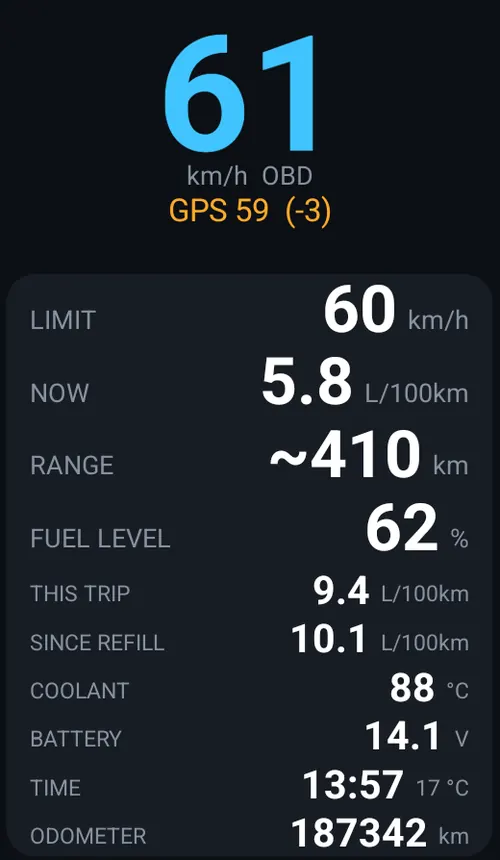
- Draws a dash on the car screen as an Android Auto navigation app: a 0 to 180 km/h dial with the GPS speed as a second marker, instant, trip and since-refill L/100 km, estimated range, outside temperature, coolant and battery. The layout changes with how much of the screen Android Auto hands over: full width, two thirds or one third.
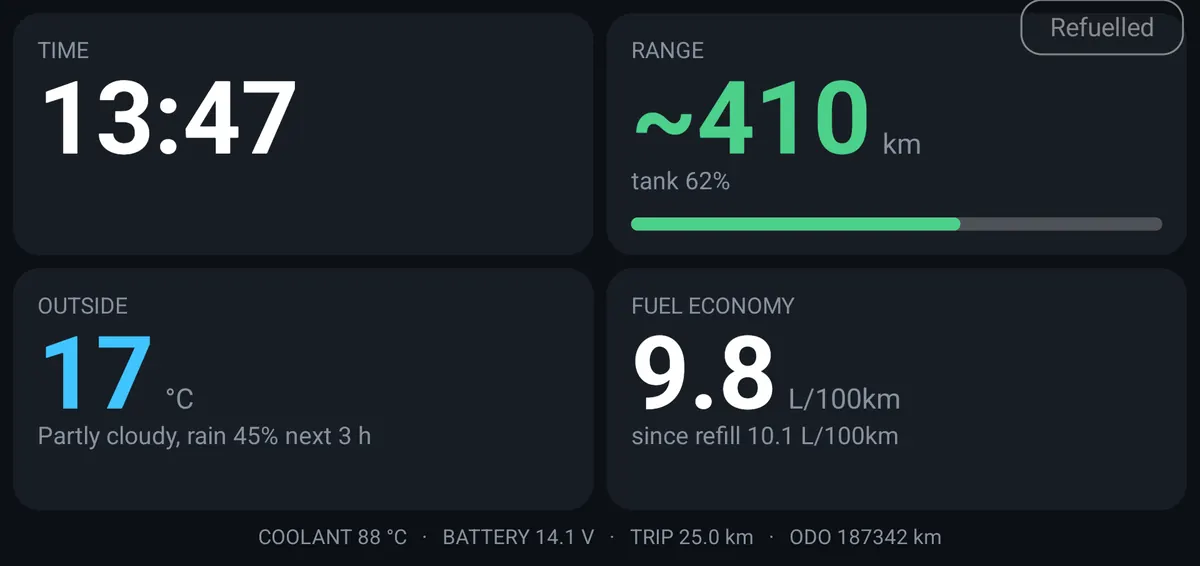
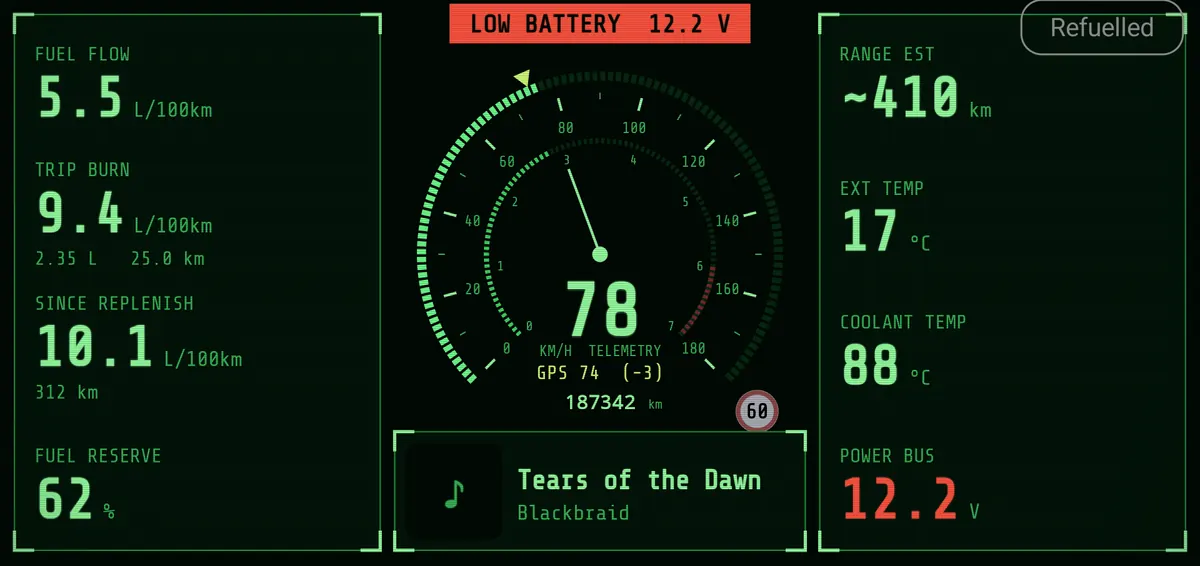
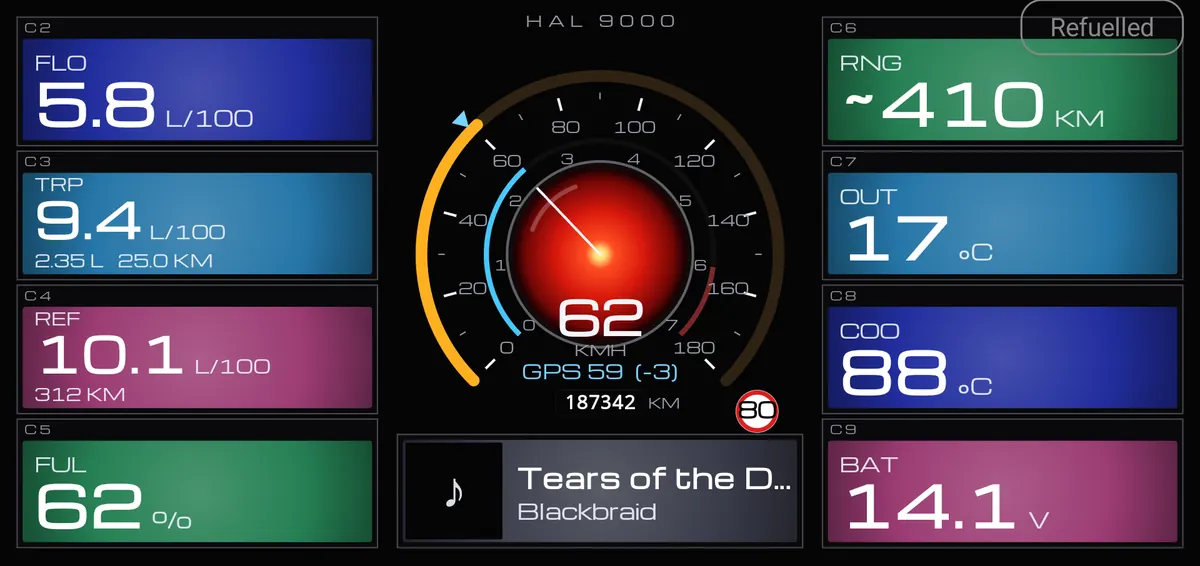
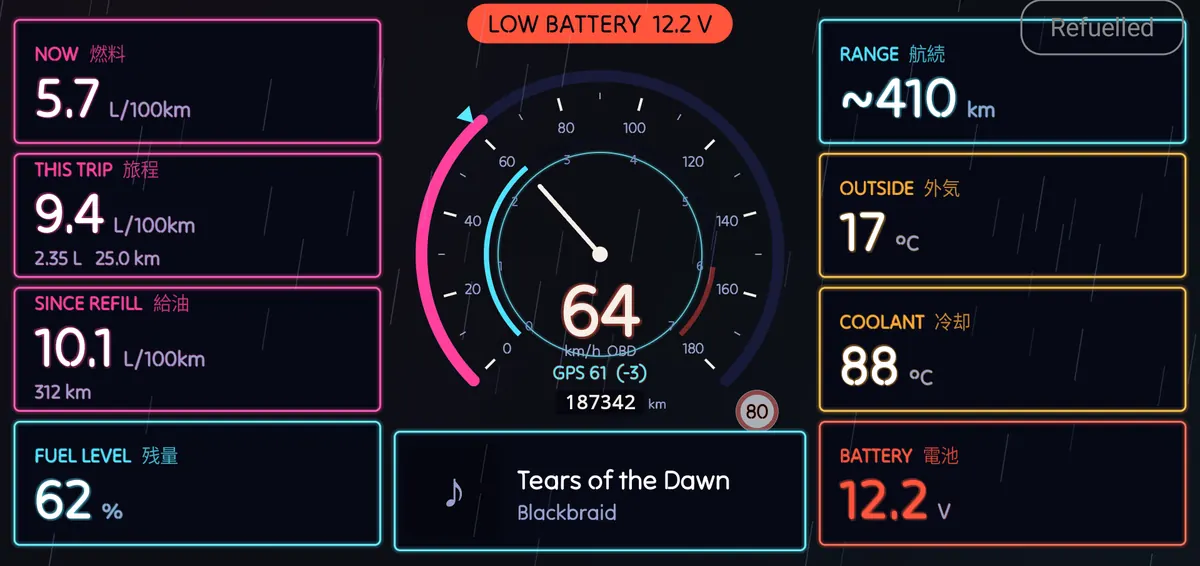
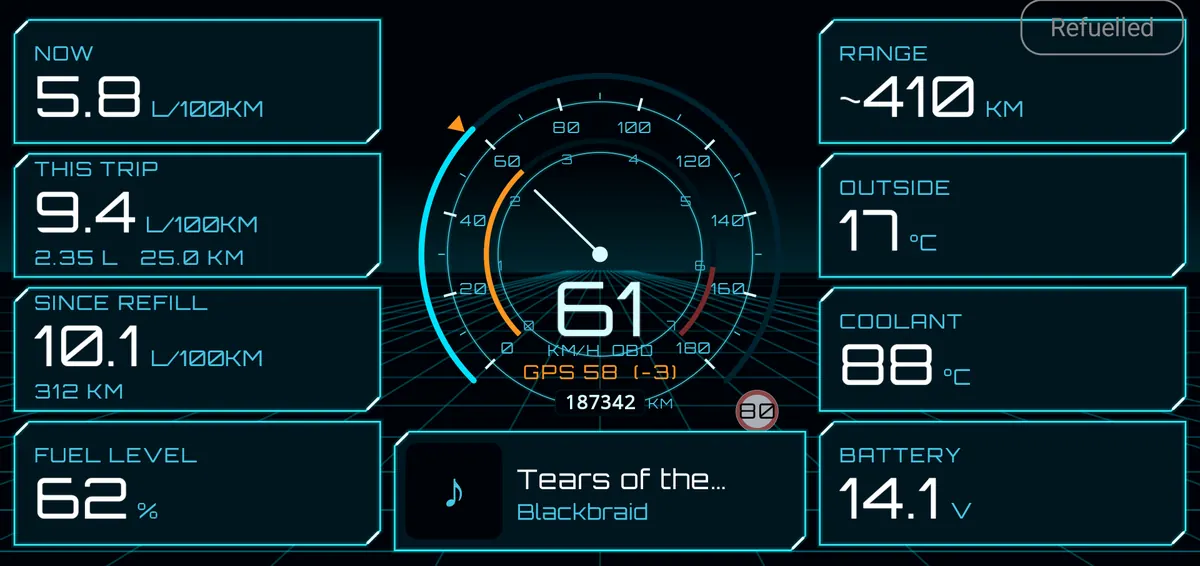
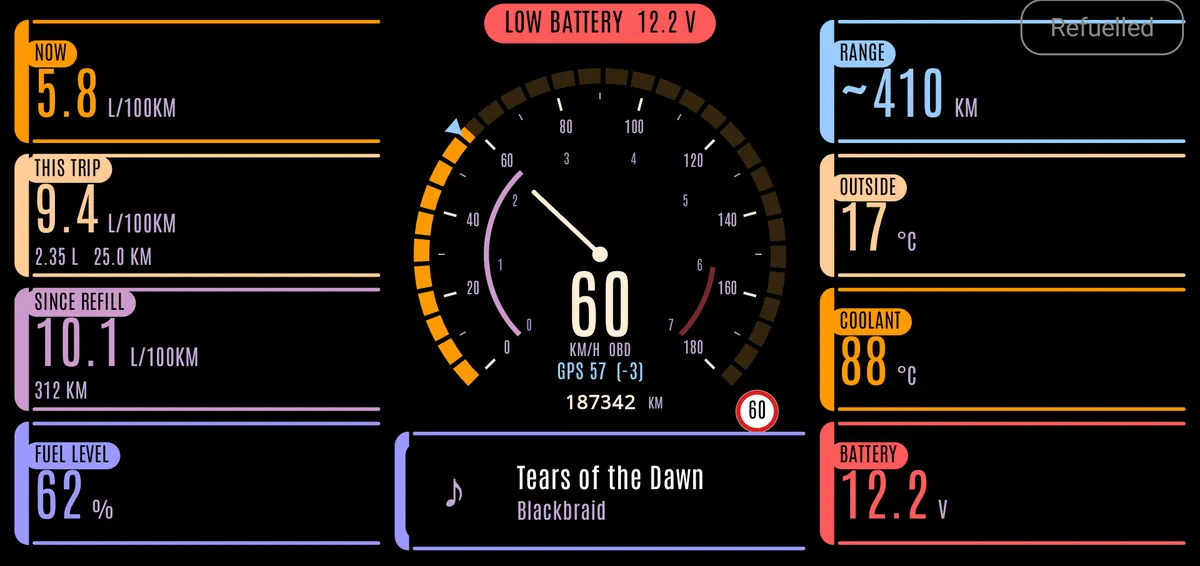
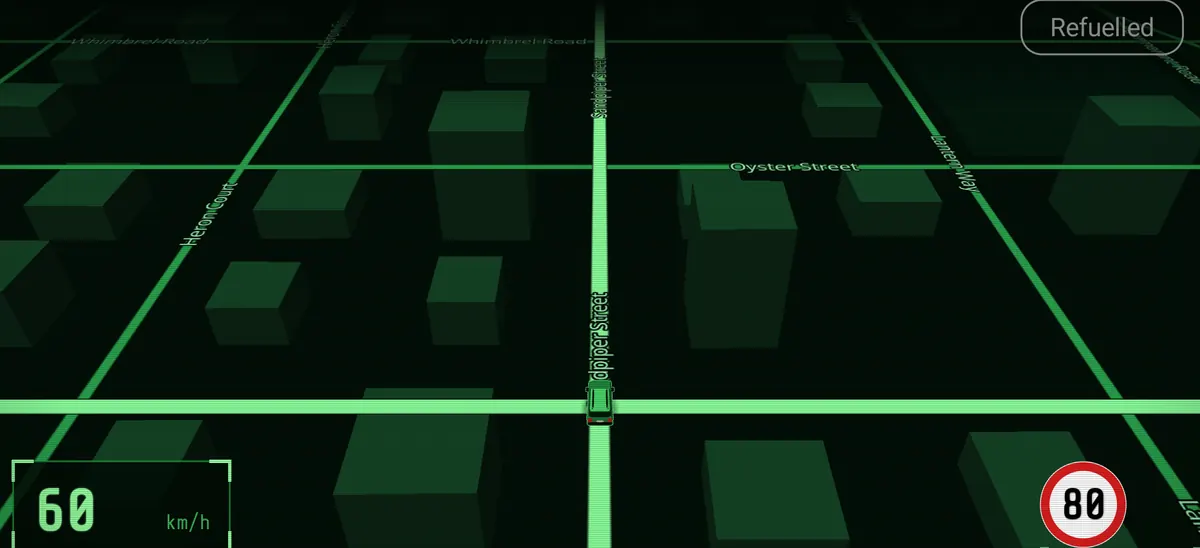
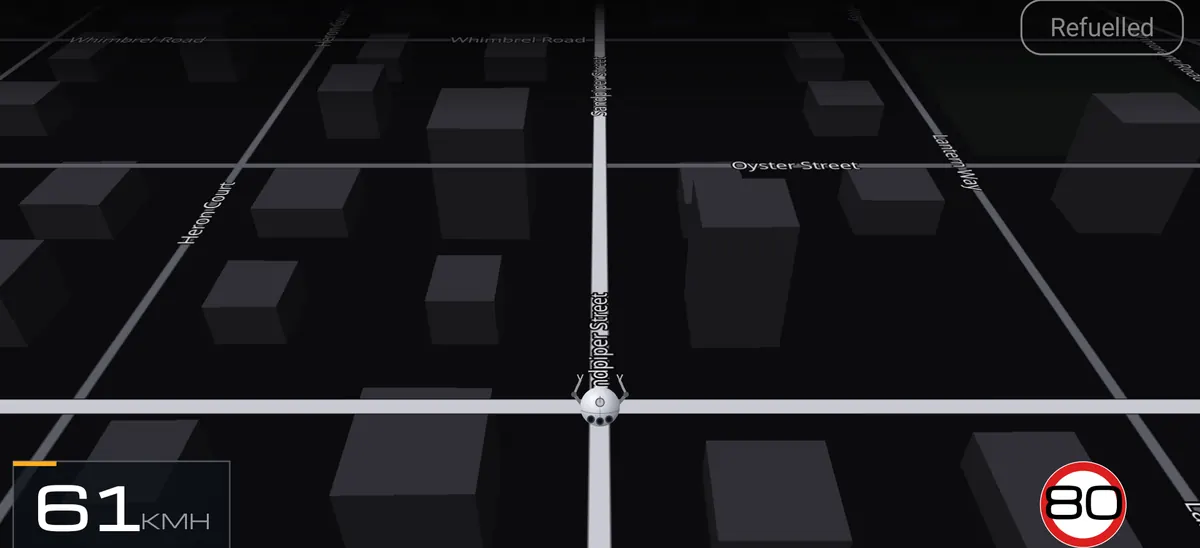
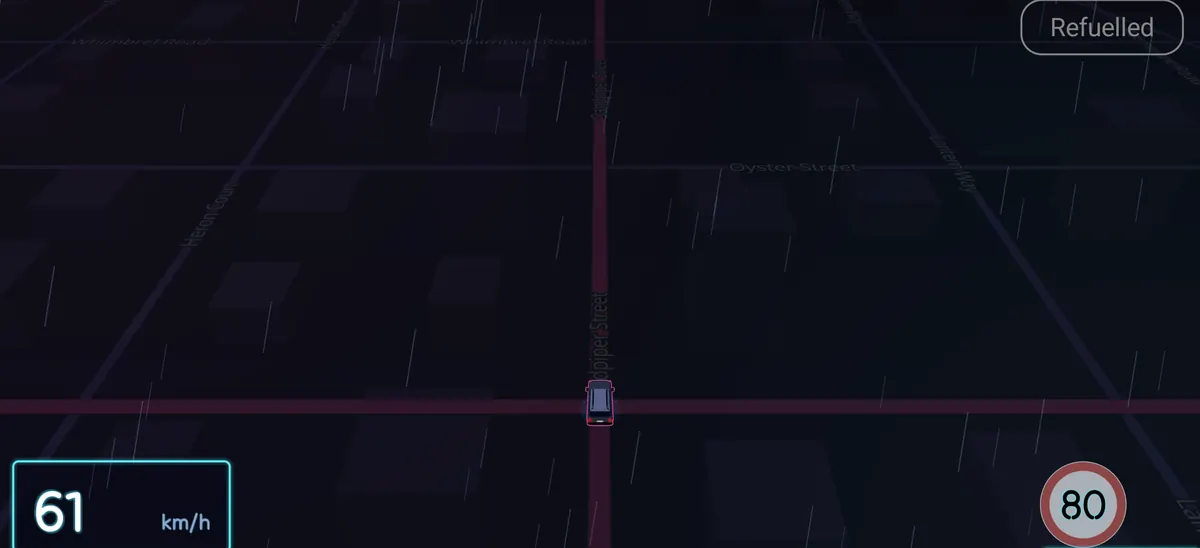
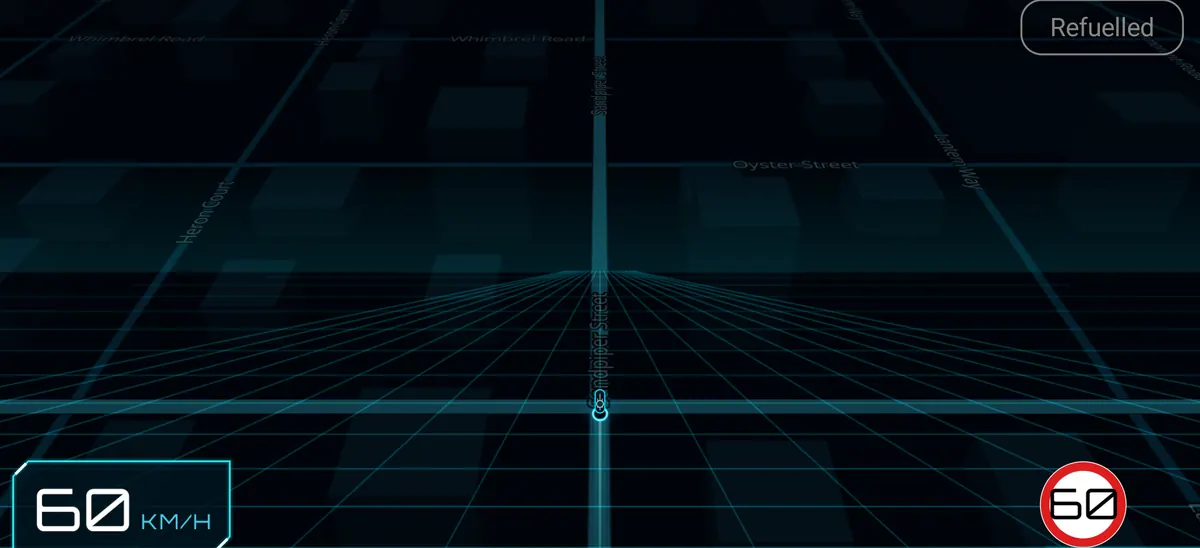
- Has three views: the full dash, a quiet view of slow-changing readings (clock, range, weather from Open-Meteo, smoothed economy), and a map view. The car screen can also take on one of several themes, besides the classic one: green-phosphor Weyland-Yutani, HAL 9000, Blade Runner, Tron and LCARS looks, each with its own power-on sequence, chosen from a picker in Setup.
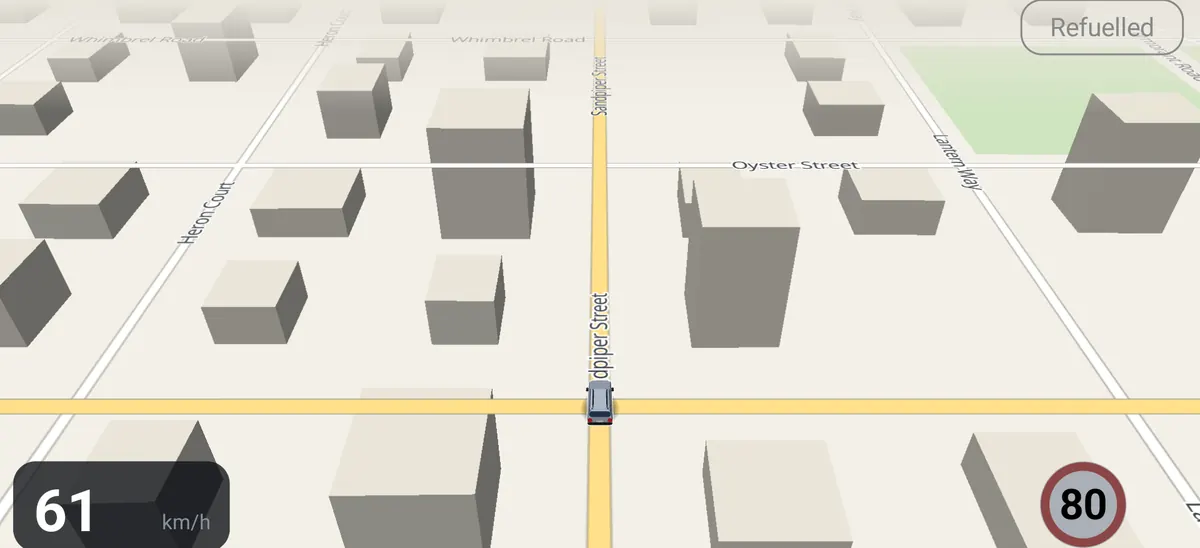
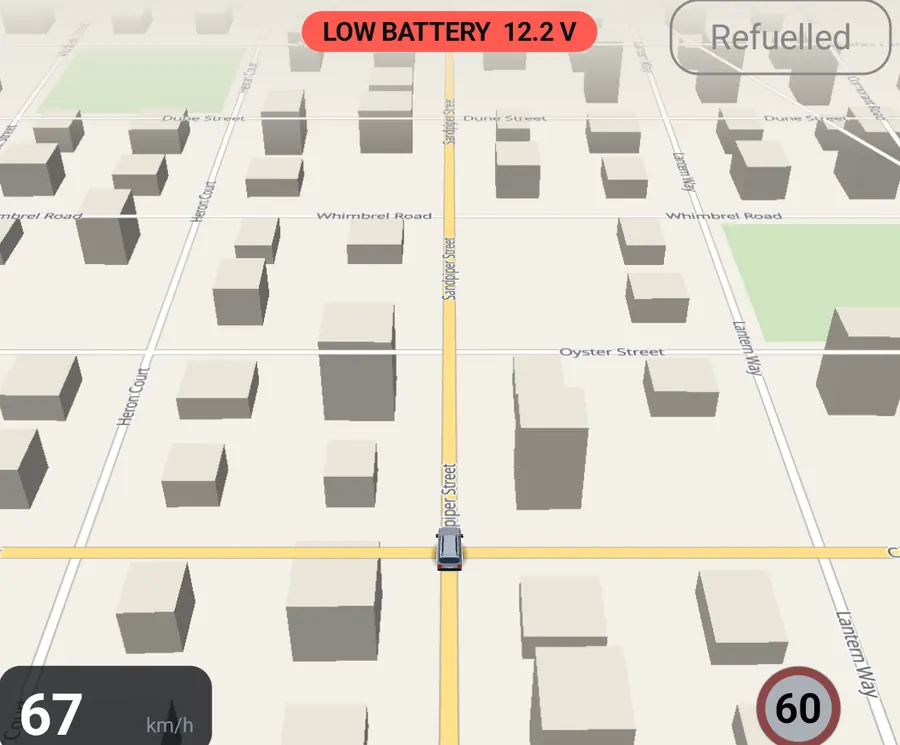
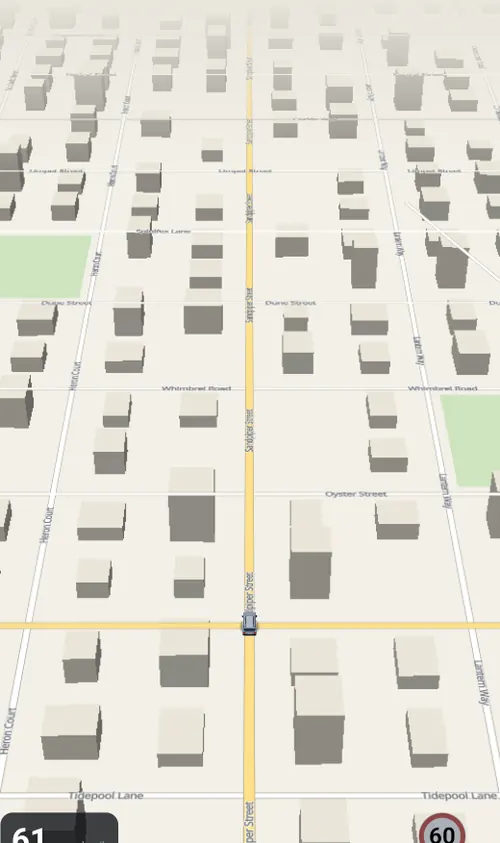
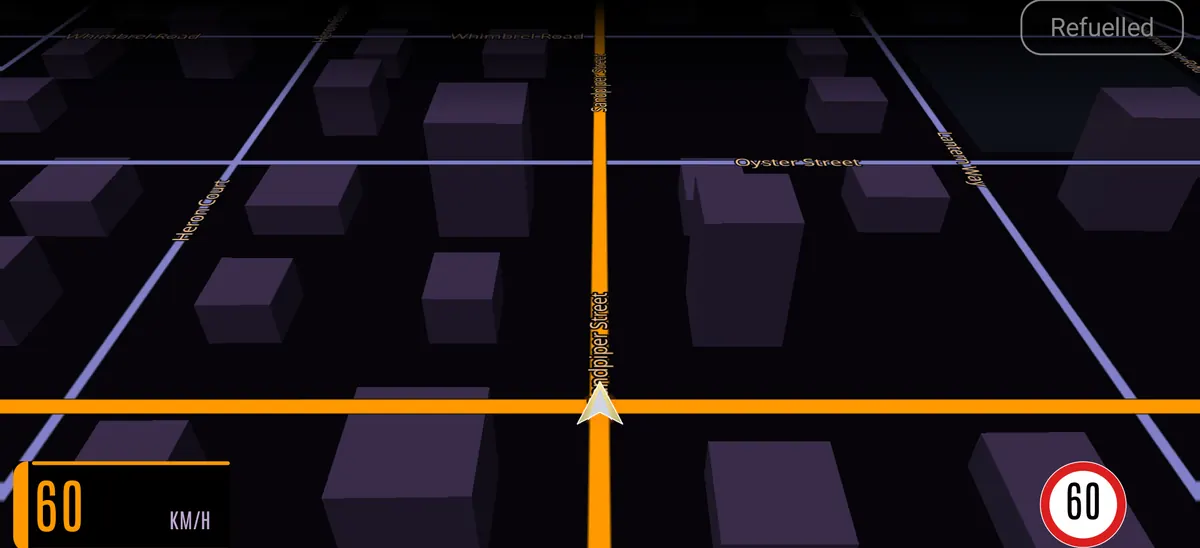
- Shows an offline map of Tasmania, with the car turning with its heading, and plans routes on the phone with no network. Search finds road names and suburbs, and "road closed ahead" reroutes around a closure for a day. Spoken directions are optional and off by default.
- Warns only when something is wrong: engine hot, battery voltage out of range, low fuel, or long-term fuel trim beyond a limit.
- Groups trips into journeys, so a run to the shops and back reads as one outing.
- Tracks fuel. It estimates use from the airflow sensor, detects a refill from a jump in the fuel gauge, asks for the price and litres, and uses real full-to-full fills to calibrate the estimate.
- Dims at night, keeps its own odometer (this car does not report one over OBD), and shows the track playing in whichever media app is active.
Screenshots
All of these are from an emulator running the app's built-in demo mode, with made-up readings and a map of an invented town, so nothing here is from a real drive or place. The demo speed wanders up and down by itself, and the small "Refuelled" button is the mock-up of the one Android Auto draws over the car screen.
Layouts
The layout follows however much of the car screen Android Auto gives the app.
Looks
Setup has a picker for the car screen look. Each look restyles the dash and the map; these are the full-width dash and the map in each, apart from the classic one above.
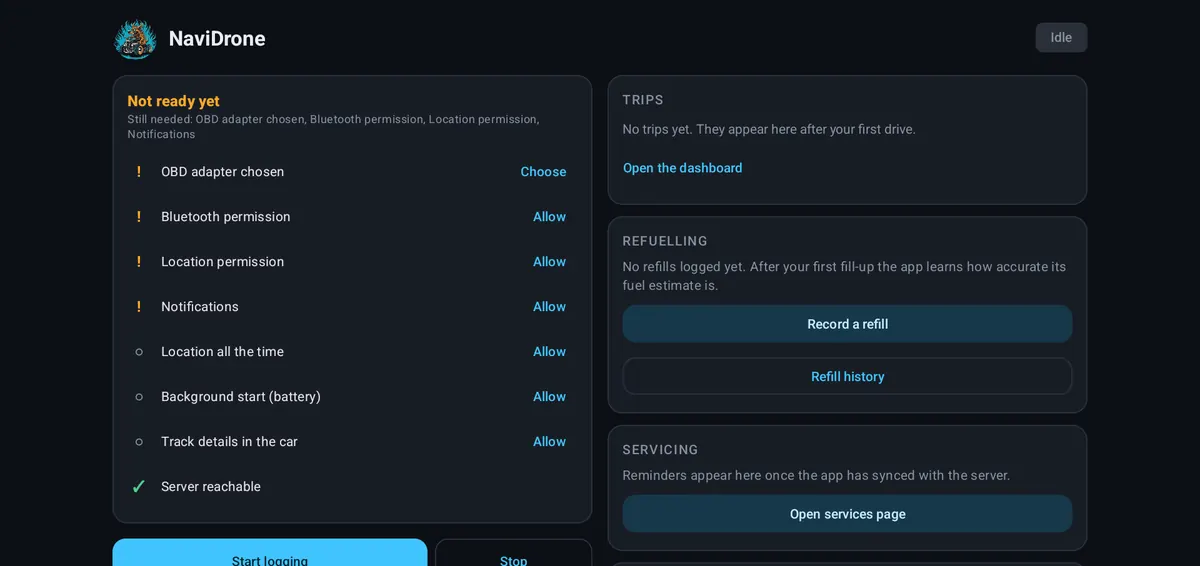
On the phone
Web dashboard
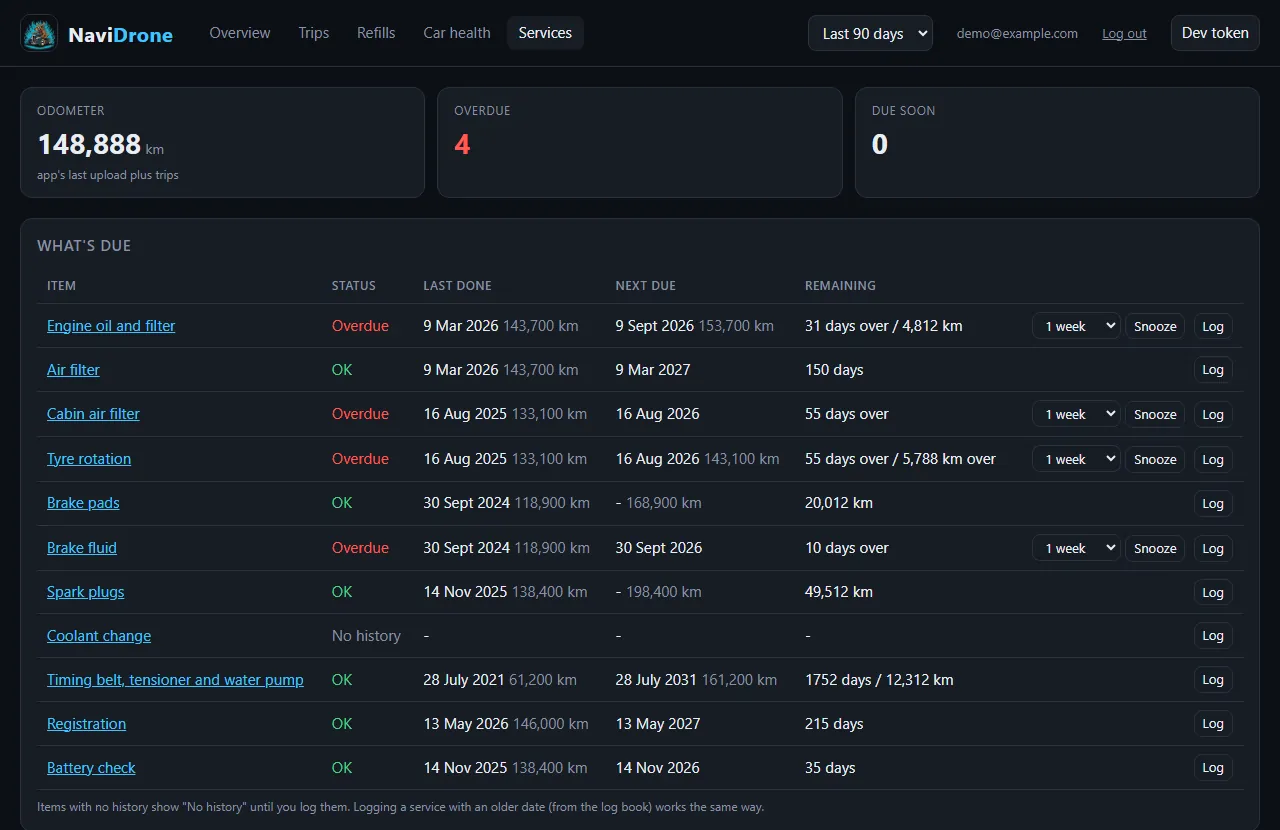
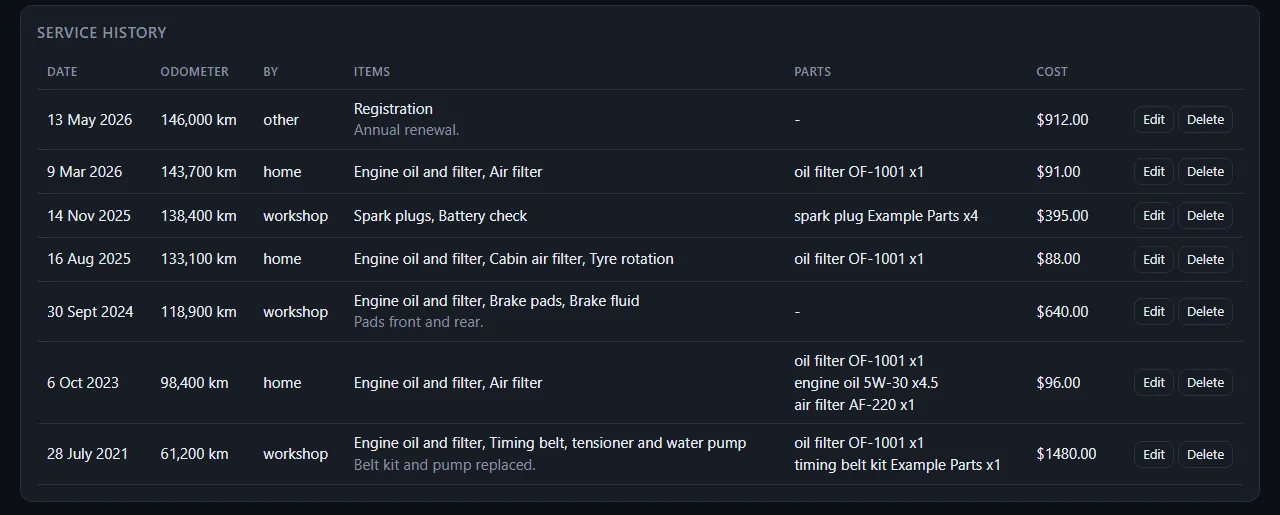
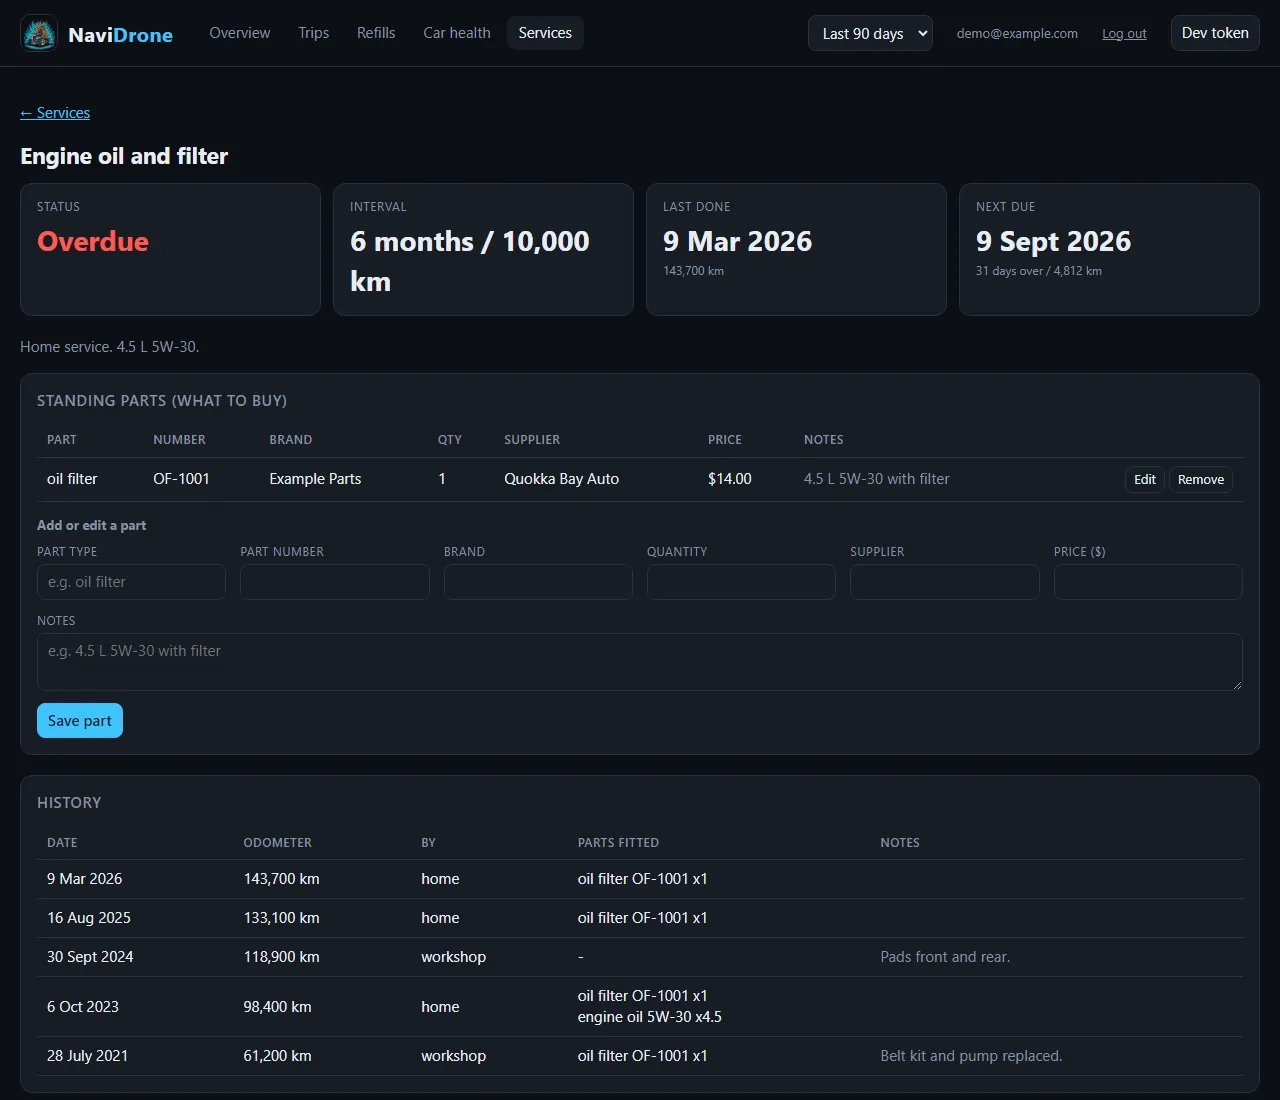
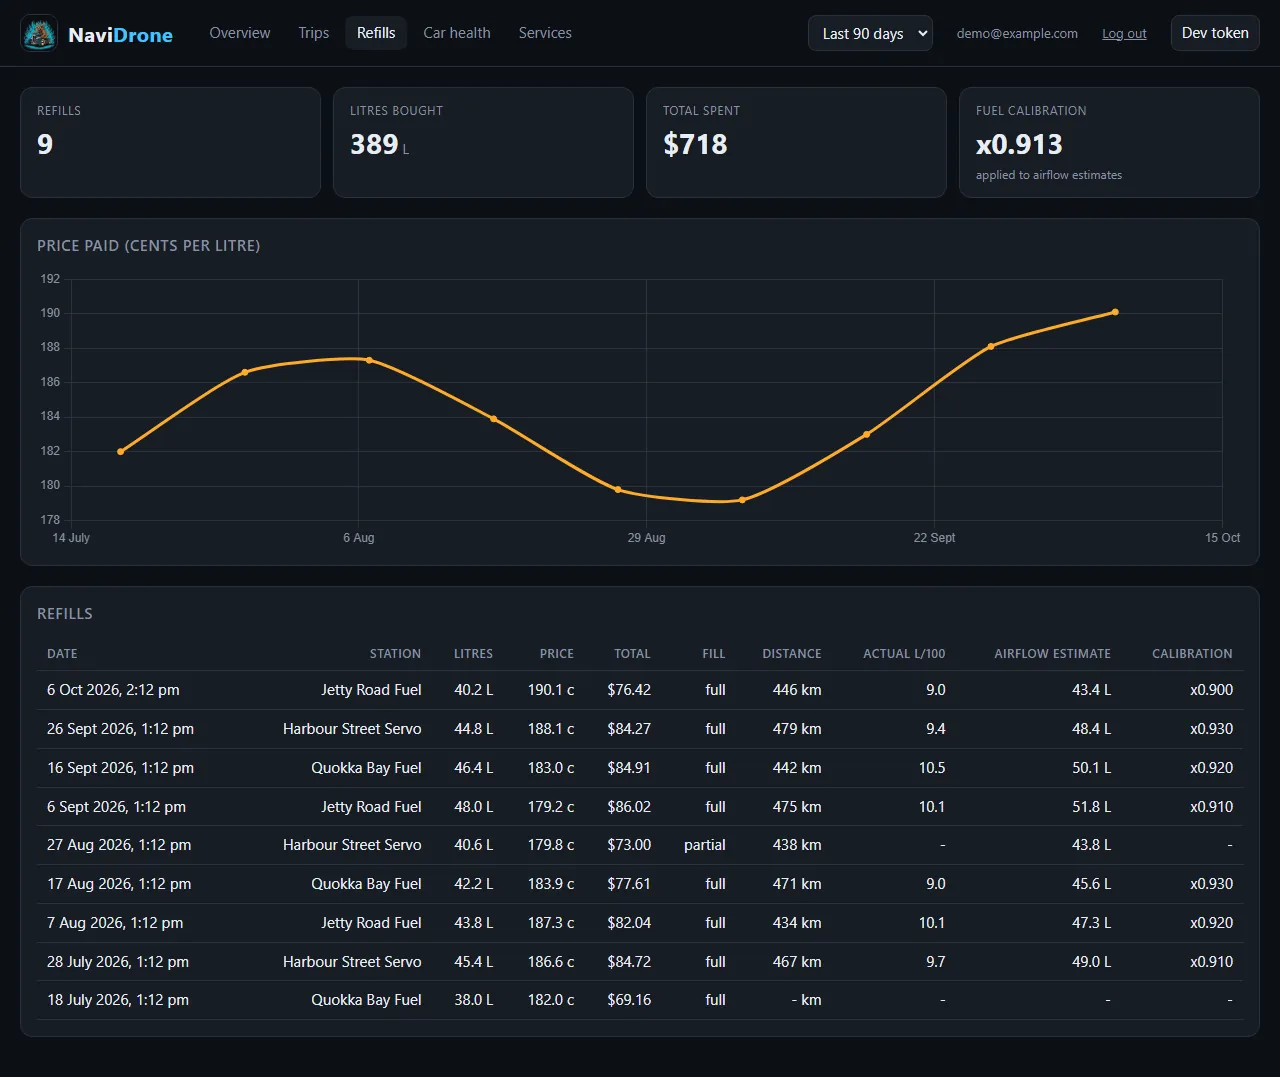
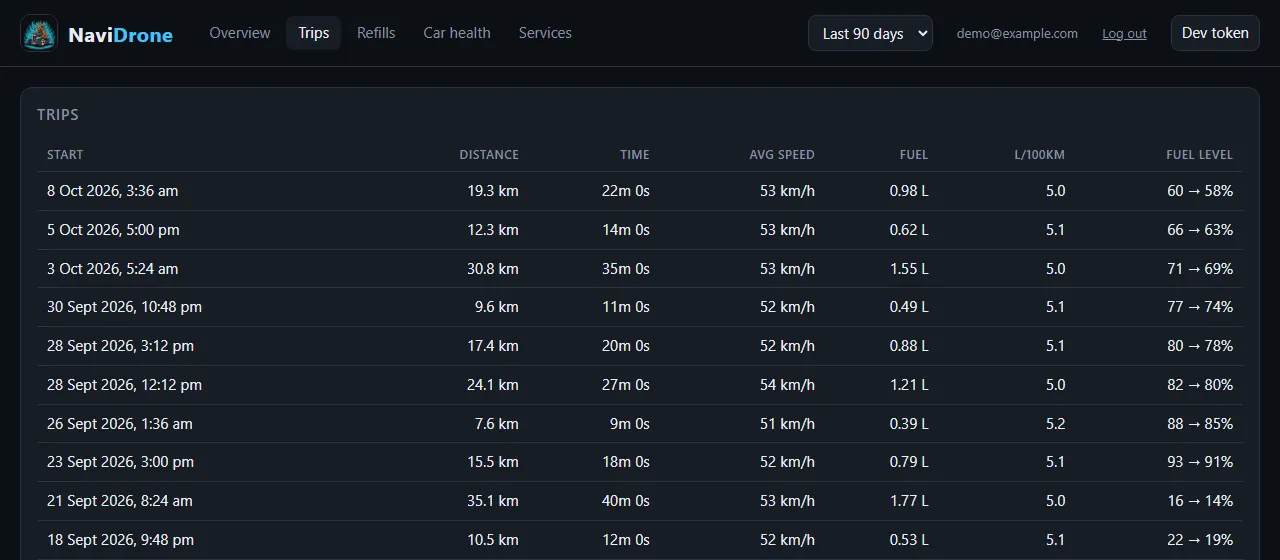
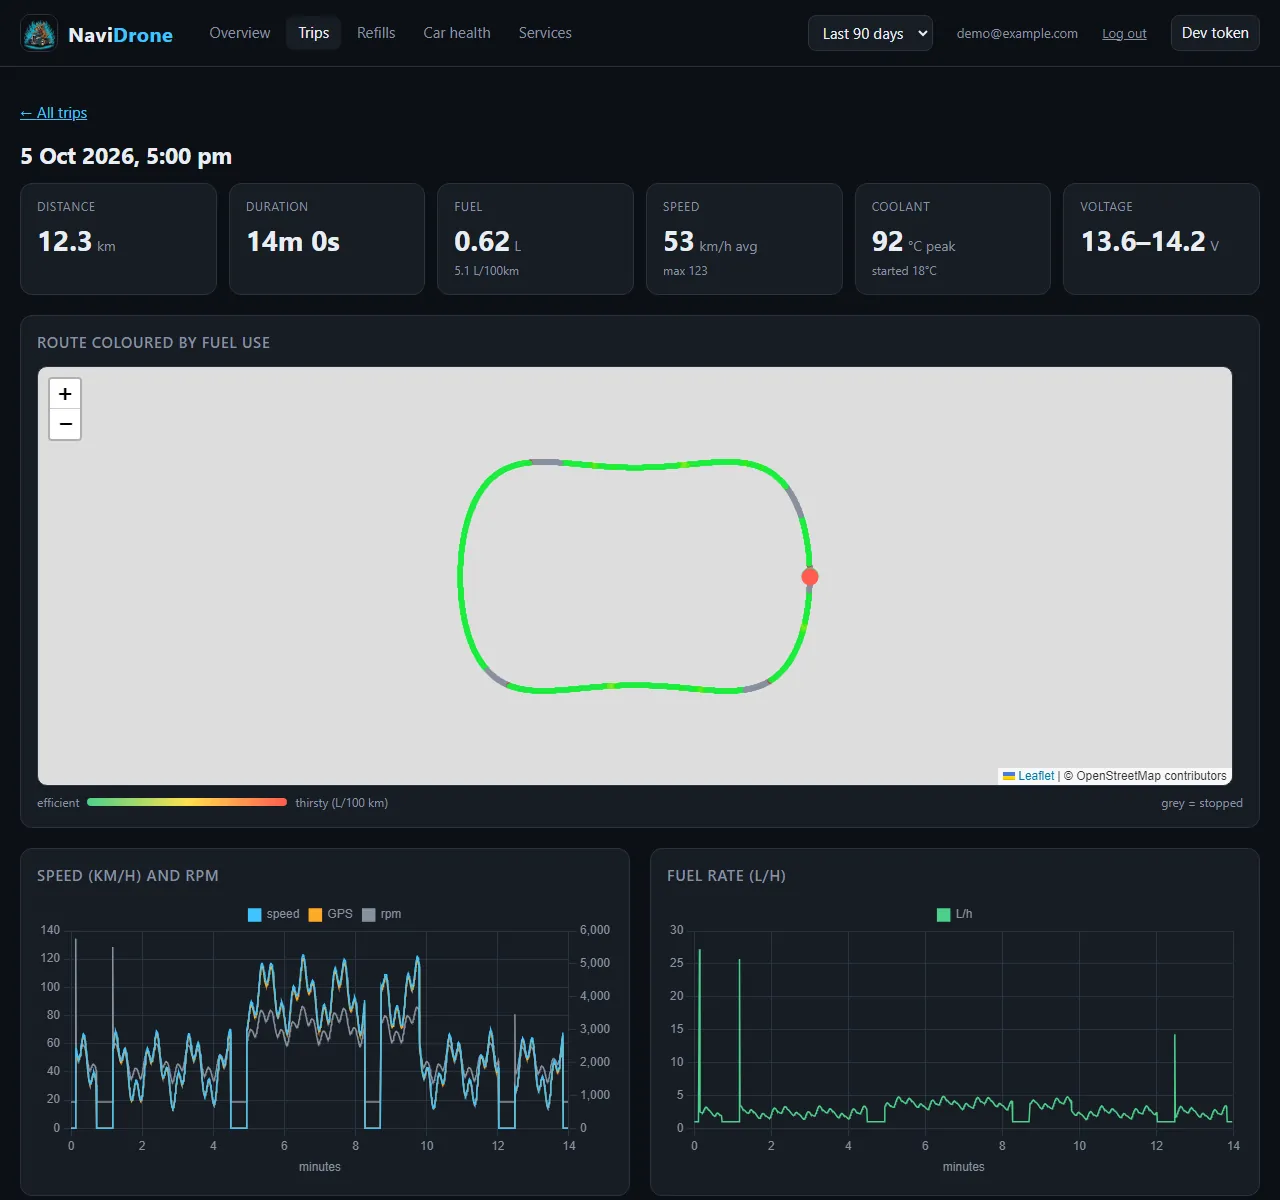
The Worker's dashboard, run locally with invented data: a made-up town, fuel stations and service records, and a placeholder login. The map is blank here because the real one draws OpenStreetMap tiles from the internet.
Under the hood
- Native Kotlin with the Android for Cars App Library, Material 3 views and no Compose. Two product flavours, phone and tablet, differ only in launcher icon.
- The ELM327 link is plain Bluetooth serial. The app sets CAN 11-bit/500k and talks to the engine ECU only, asking for up to six standard PIDs per request.
- The car screens are drawn by the app itself onto the car's surface. The map is MapLibre rendering a single Protomaps PMTiles file to bitmaps, with the map drawn at a fixed logical width and scaled so it looks the same on a tablet and a car display.
- To keep the car on the road, its position is predicted forward to when the frame will be shown and snapped to the nearest road in the direction of travel. The roads are read straight out of the map file by a small PMTiles and vector-tile reader. Heading is fused from the gyroscope and GPS course, because the phone compass turned out to be tens of degrees out.
- Routing is A* over a road graph built from OpenStreetMap by a script and bundled in the app, with turn restrictions, one-ways, roundabouts and speed limits.
- The Worker (Cloudflare Workers, D1 and R2) stores trip summaries in D1 and raw CSVs in R2, and serves a single-file dashboard with five tabs: an overview, trips, refills, car health and services. Trips are grouped into journeys, and a trip opens to a route map coloured by fuel use plus speed, fuel rate, temperature and voltage charts. Refills shows price paid and real tank-to-tank economy, and car health charts fuel trim, battery voltage, coolant and speed over time. Services keeps a service history and works out what is due by distance or date, with snoozing, checklists, and the parts used for each job.
- Fuel prices come from a daily cron against a public fuel price API, with the key held only in the Worker and never in the app. Cloudflare Access sits in front of everything, and the Worker verifies the Access JWT itself and fails closed. The app sends a service token.
- Pure logic such as trip grouping, refuel detection, routing, due-date calculation and Access verification has unit tests.