Cloudflare Usage
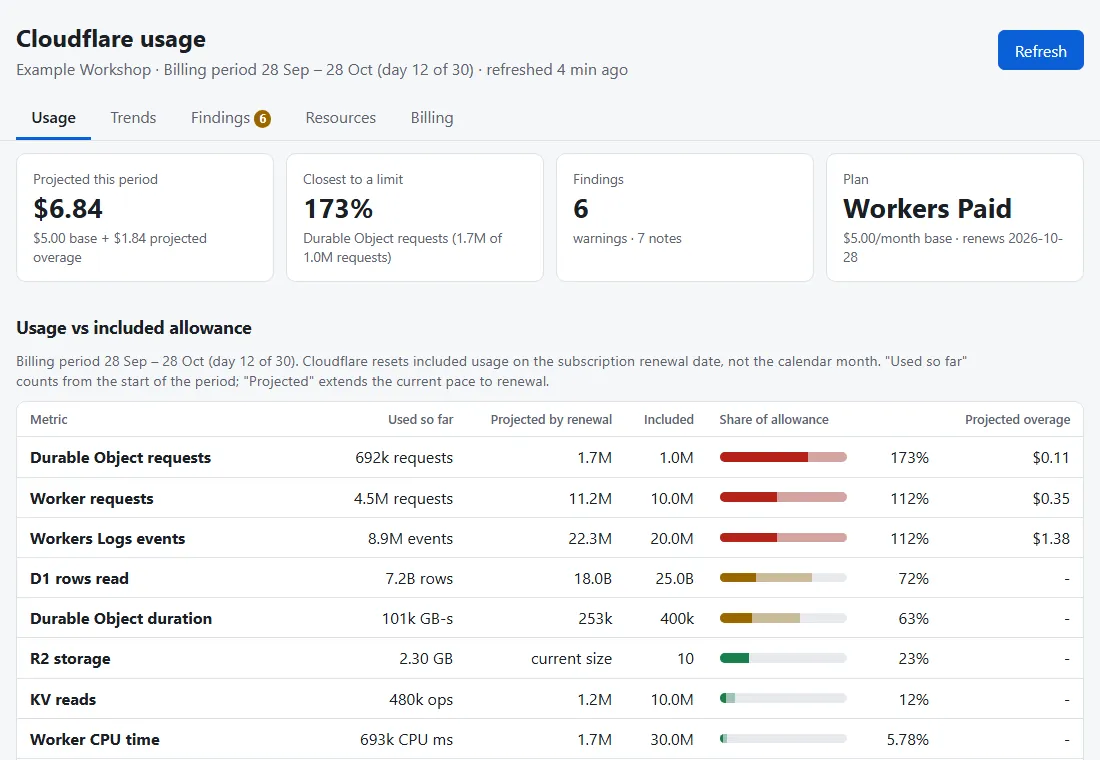
A small read-only dashboard for a Cloudflare account. It shows usage against the plan's included allowances, projects the bill to the renewal date and lists plain-rule findings about things that cost money or sit idle.
What it does
- Compares usage with the included allowance for Workers requests and CPU time, Durable Objects, D1, KV, R2 and Workers Logs, and estimates the month's bill as the base plan plus projected overage.
- Measures from the start of the billing period, because Cloudflare resets included usage on the subscription renewal date and not on the first of the month. Usage so far is extended at the current pace to renewal. If no period can be read it falls back to a rolling 30 days and says so.
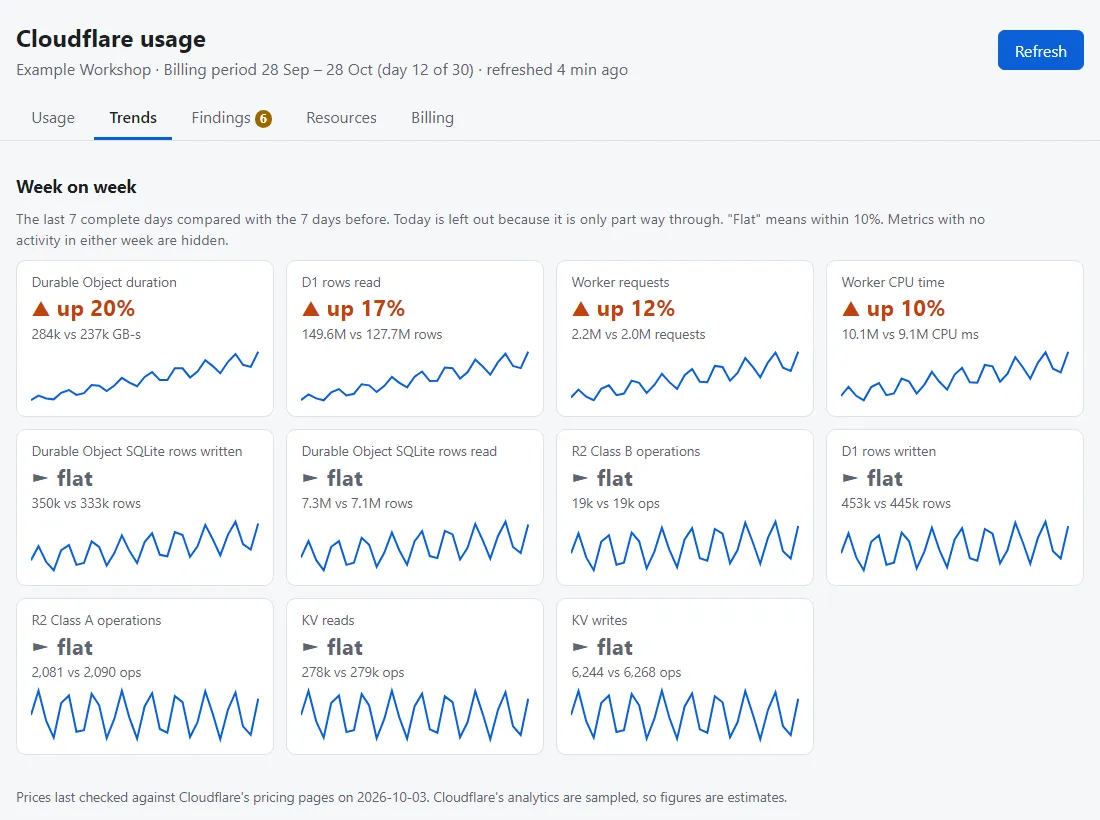
- Compares the last seven complete days with the seven before, per metric, using a 31-day daily series stored with each snapshot.
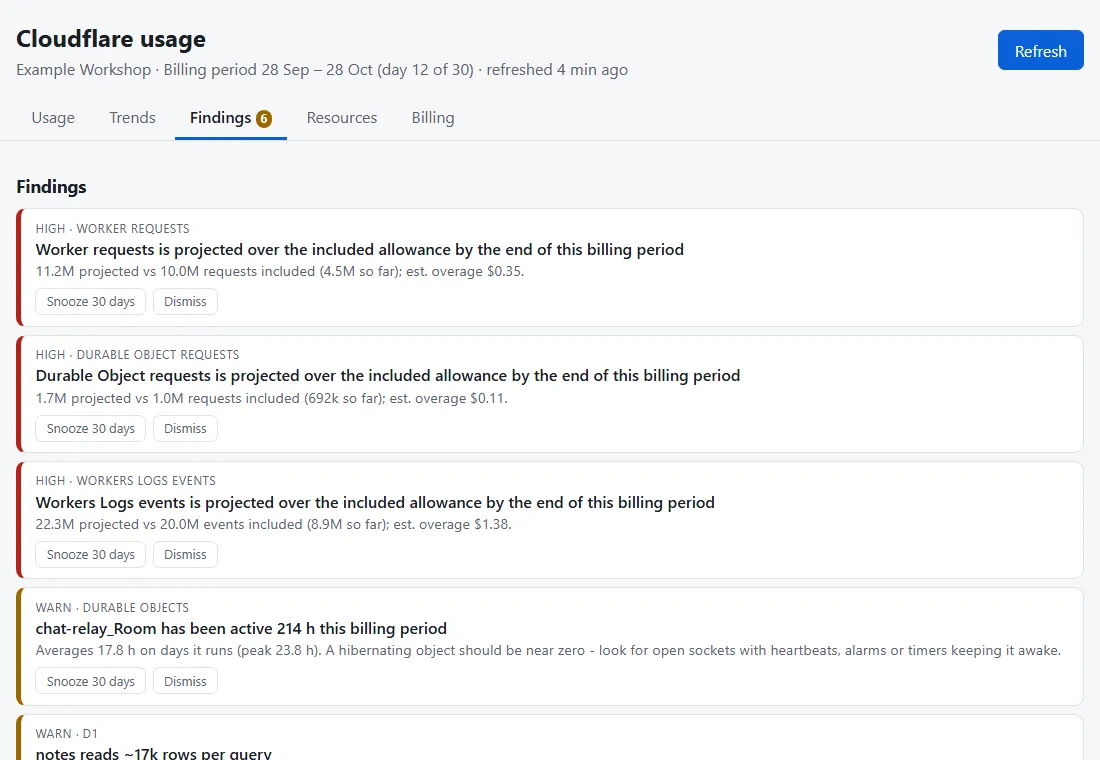
- Raises findings from fixed rules: usage projected over or near an allowance, a sharp week-on-week rise, a Durable Object that stays awake for hours, a D1 database reading thousands of rows per query, logging sampled at 100%, frequent crons, error rates, and Workers, R2 buckets or KV namespaces with no traffic.
- Findings can be snoozed for 30 days or dismissed until restored. Hiding one never changes the cost estimate.
- Refresh is manual. Pressing it collects a new snapshot, at most once a minute.
Under the hood
- A single Cloudflare Worker with static assets and a D1 database. It only reads from Cloudflare, using the REST API, the GraphQL analytics API and Workers Observability, through one read-only API token.
- Each snapshot is stored raw in D1 (the latest 60 are kept). Cost, trends and findings are recomputed from the raw data on every read, so changing a price or a rule also applies to older snapshots.
- The rules, prices and projection are pure functions with no network access, covered by Node's built-in test runner. There is no language model in the loop. The price table records the date it was last checked and says so on the page.
- Each section of the collector fails separately. A missing token permission shows up as a finding and the rest of the page still renders.
- Cloudflare's GraphQL API refuses ranges over 32 days, which is why the daily series is 31 days. Analytics are sampled, so the figures are estimates, and some billed items (stored data in Durable Objects and KV, domain renewals) are not measured.
- The Worker verifies the Cloudflare Access token itself and refuses every request until it is configured. A service token can reach one status endpoint only, which feeds the "My Day" dashboard.
- Plain JavaScript with no framework, no inline script or style under a strict content security policy, and light and dark themes that follow the system.
A personal tool for one account. Dollar figures are estimates from published prices, not an invoice. Screenshots use invented figures and resource names.